Assessing filaments, floc, and higher-life for proactive process control.
Microscopy becomes an operating signal
As captured
With Nymph AI Vision
HealthyStableWarningWorseningUpset
A quiet upset hidden behind a healthy SVI
April - May biology target index SVI MLSS Vision risk Target
Patent
Automated organism detection for wastewater treatment.
A patented system for capturing microscopy images of activated sludge, classifying organisms and
floc characteristics using deep learning, and generating corrective action recommendations in real time.
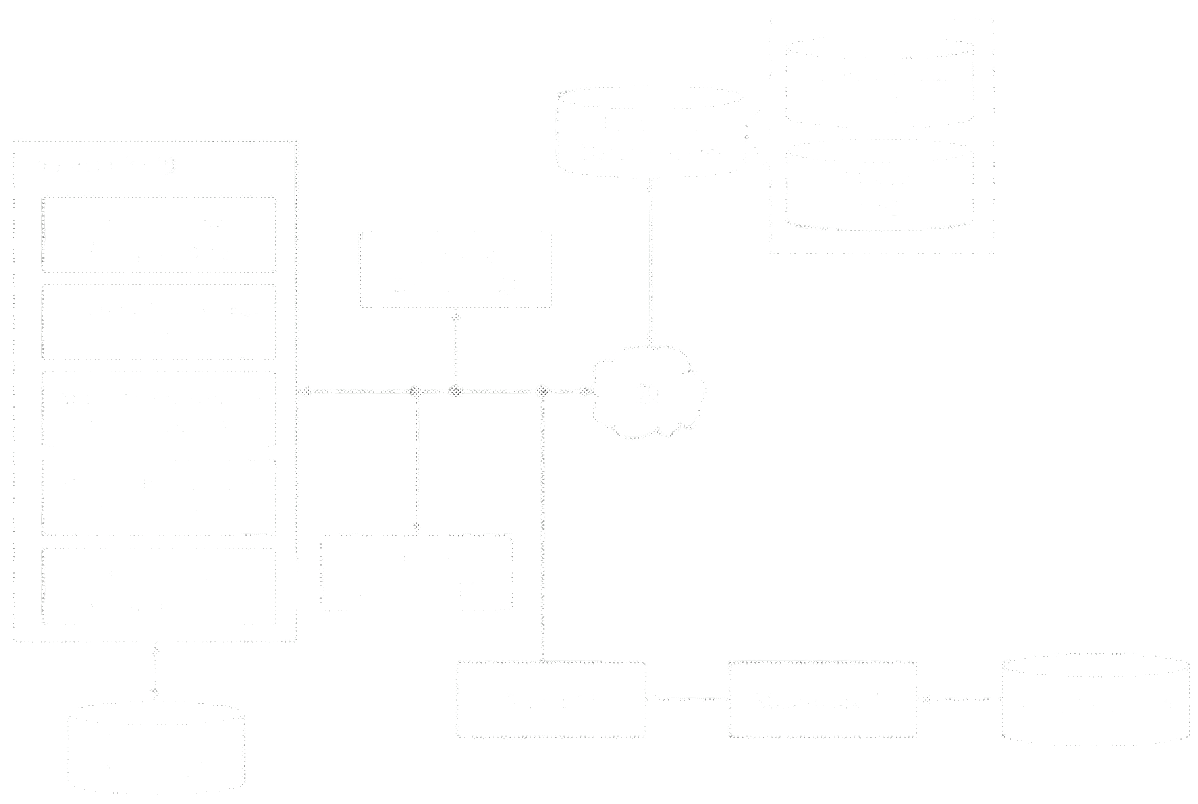
Fig. 1 - System architecture
End-to-end pipeline from basin to corrective action
An operator collects a sludge sample and places it on a slide, which is then imaged through a microscope
and sensor. That data routes through the cloud to a five-component processor stack: Preprocessing (30),
Training (32), Attribute Recognition (34), Density Recognition (36), and Correction (38).
prediction database stores all training data and deployed models. Results are delivered to
a user interface device, giving operators actionable output without manual microscopy or lab turnaround.
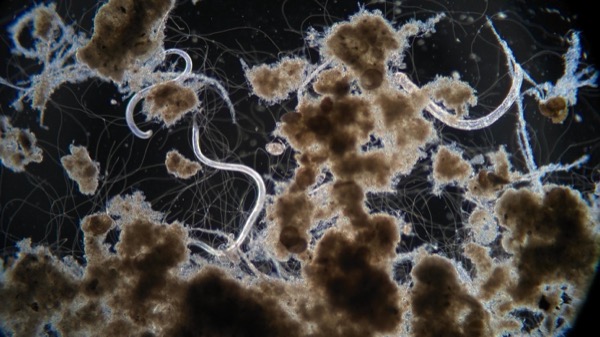
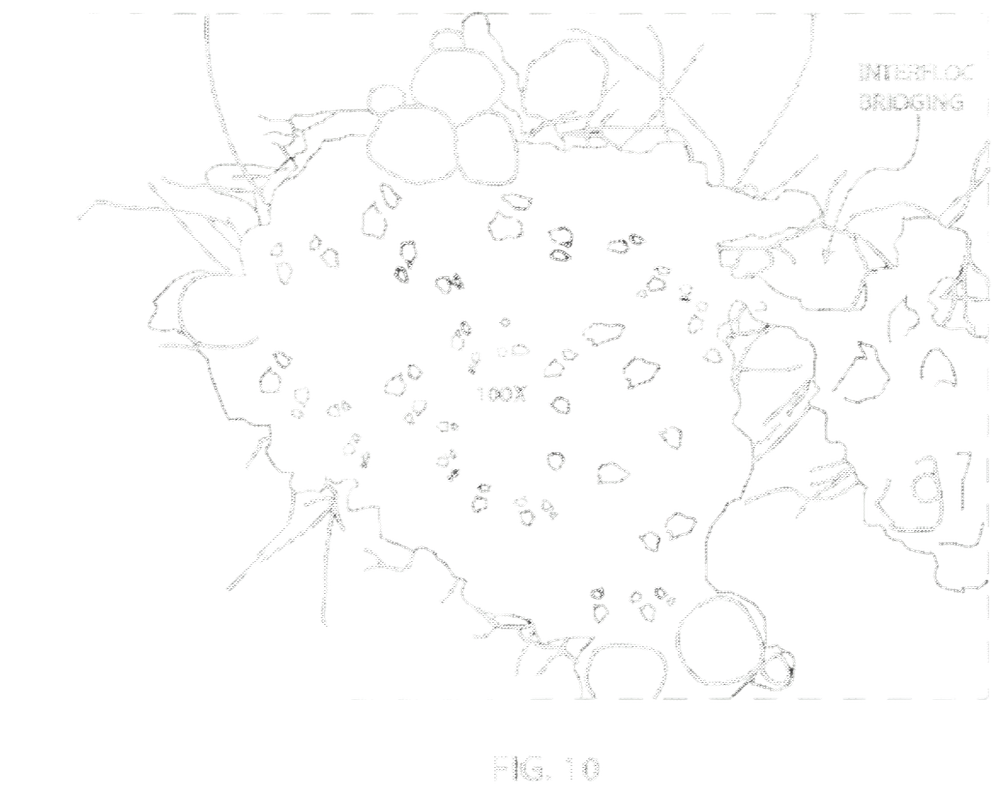
Filaments connecting floc particles.
FIG. 10 - Interfloc bridging
FIG. 10 shows interfloc bridging at 100x magnification - filamentous organisms growing
between and connecting individual floc particles. This is a key early indicator of filamentous
bulking, where the sludge mass knits together, impairing settling performance in the clarifier
before the problem becomes severe.
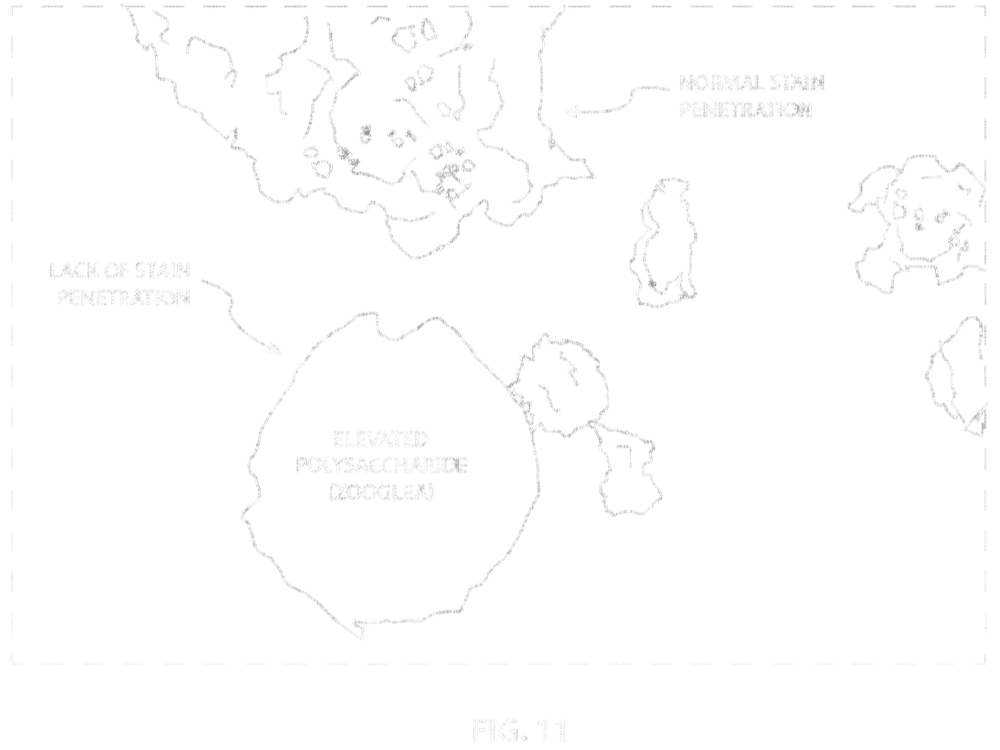
Normal floc vs. Zooglea.
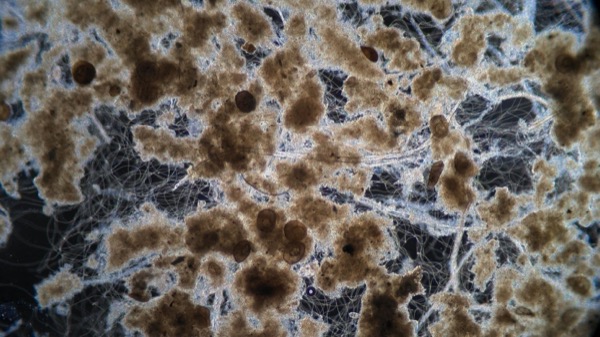
FIG. 11 - Elevated polysaccharide
FIG. 11 contrasts normal stain penetration with lack of stain
penetration, which indicates elevated polysaccharide - a condition associated with
Zooglea-dominant sludge. Elevated polysaccharide is typically caused by high organic acid
loading or low dissolved oxygen, and results in a viscous, poorly settling sludge.
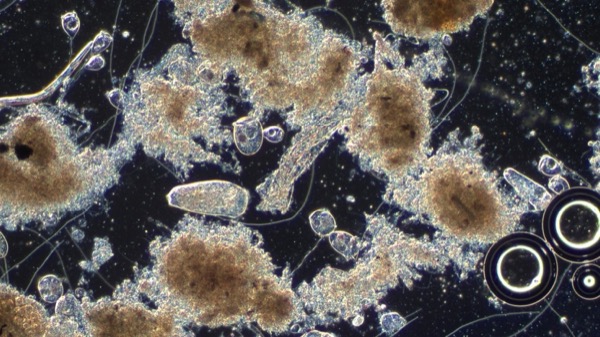
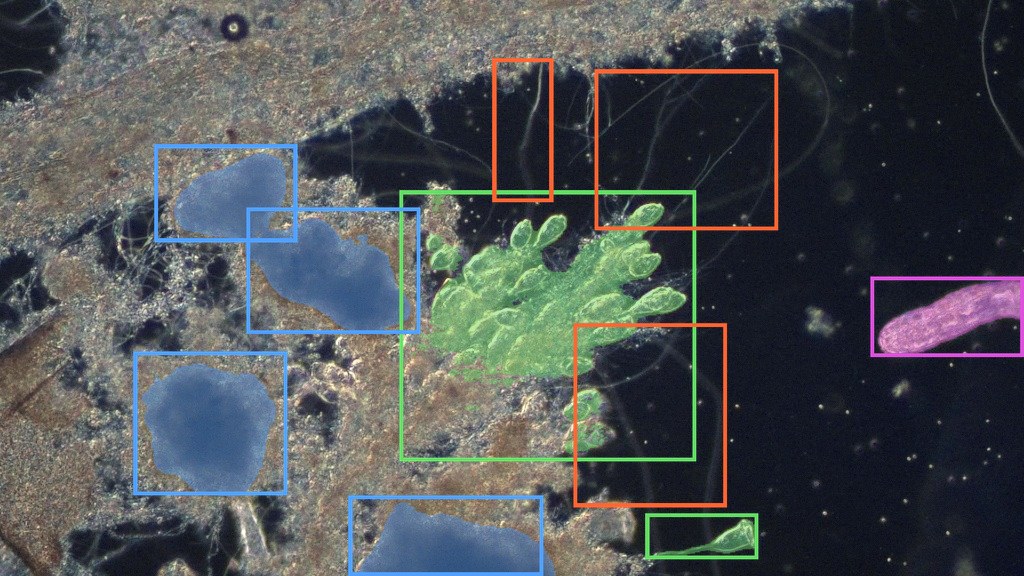
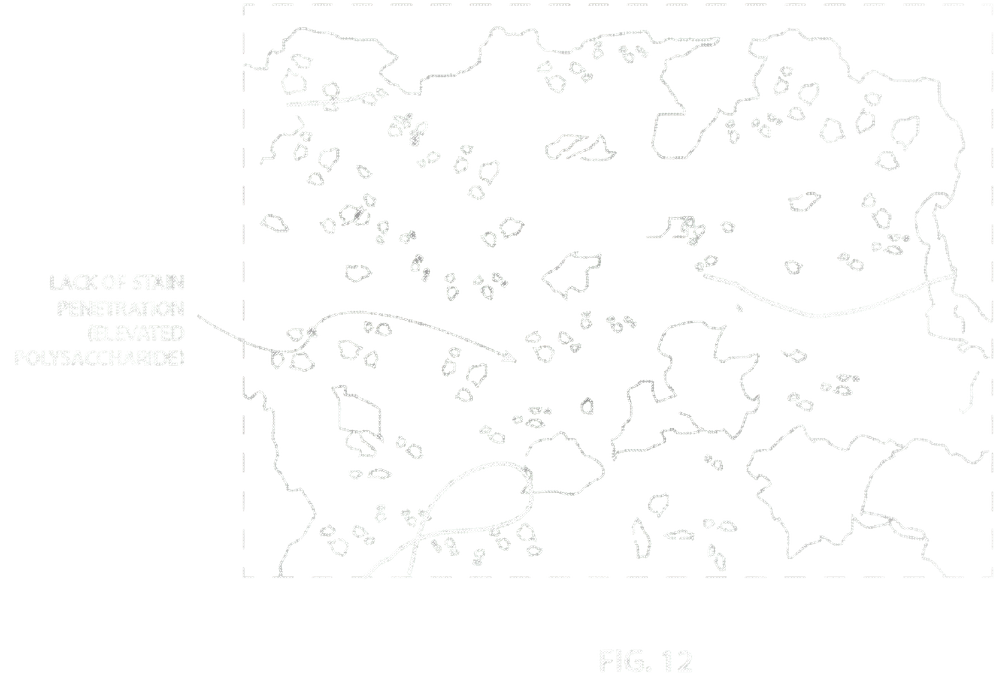
Detecting polysaccharide in the floc matrix.
FIG. 12 - Stain penetration analysis
FIG. 12 shows a real sample with stain penetration analysis, indicating elevated polysaccharide within the
floc matrix itself. The system detects this characteristic automatically from the image - without requiring
an operator to manually interpret staining results or compare against reference slides.
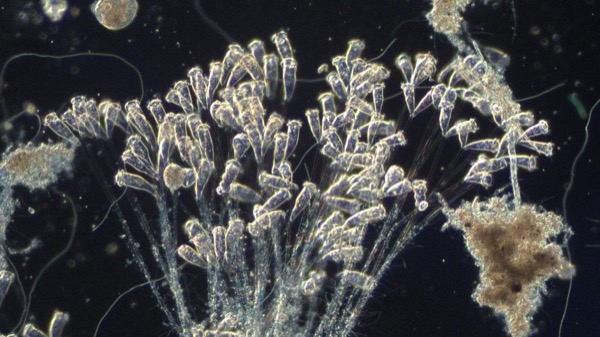
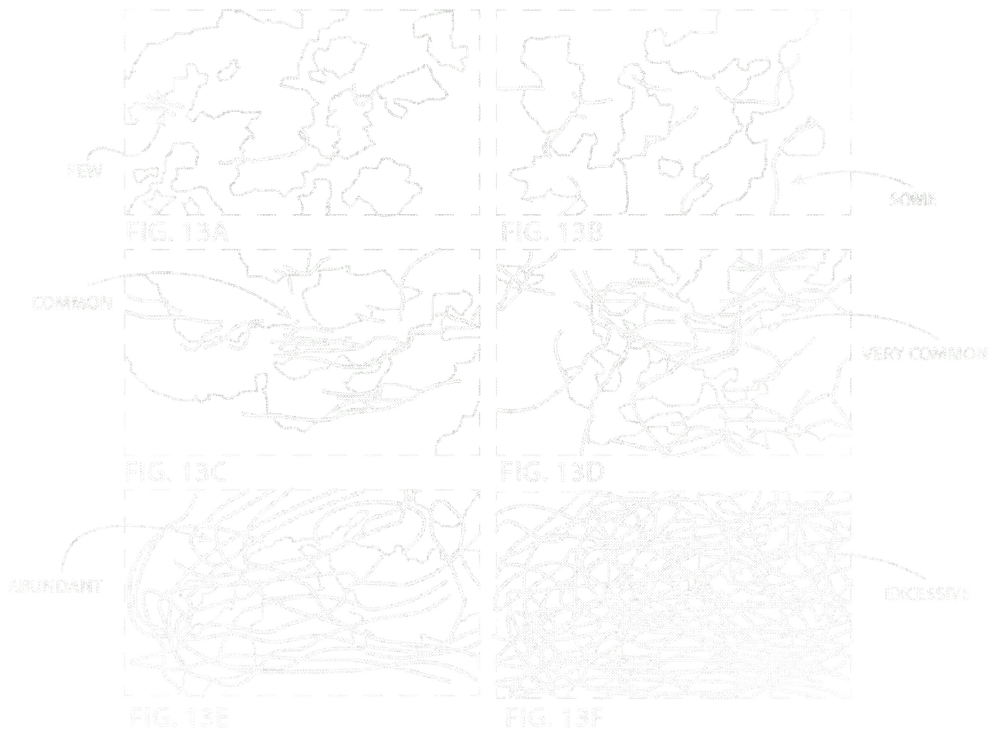
A six-level grading scale.
FIG. 13 - Filament density
The system quantifies filamentous organism density across six levels: Few (13A),
Some (13B), Common (13C), Very Common (13D),
Abundant (13E), and Excessive (13F). Density grading determines the
urgency and specificity of the corrective recommendation.
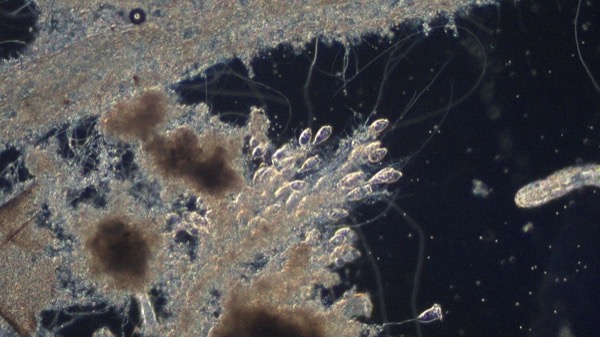
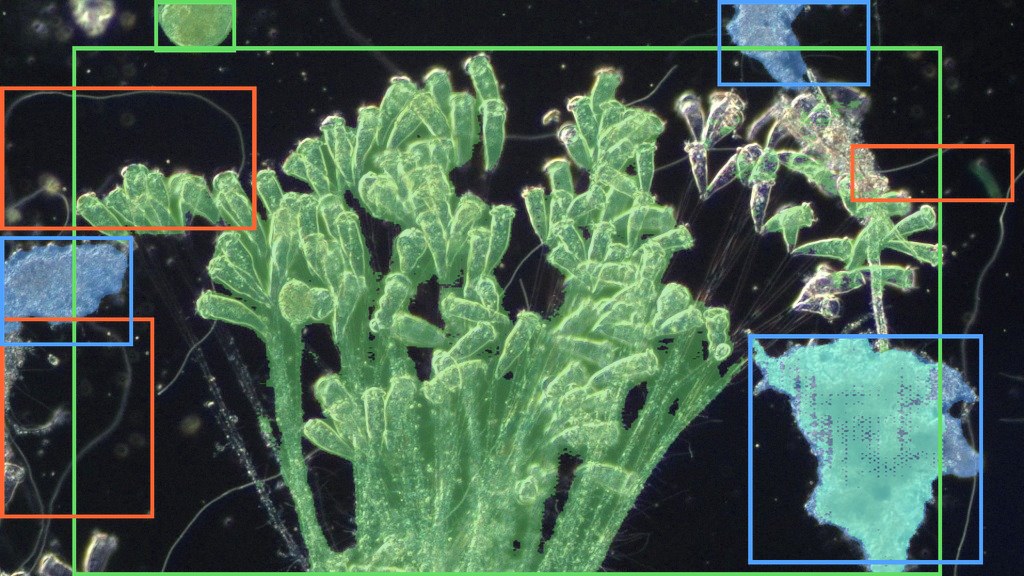
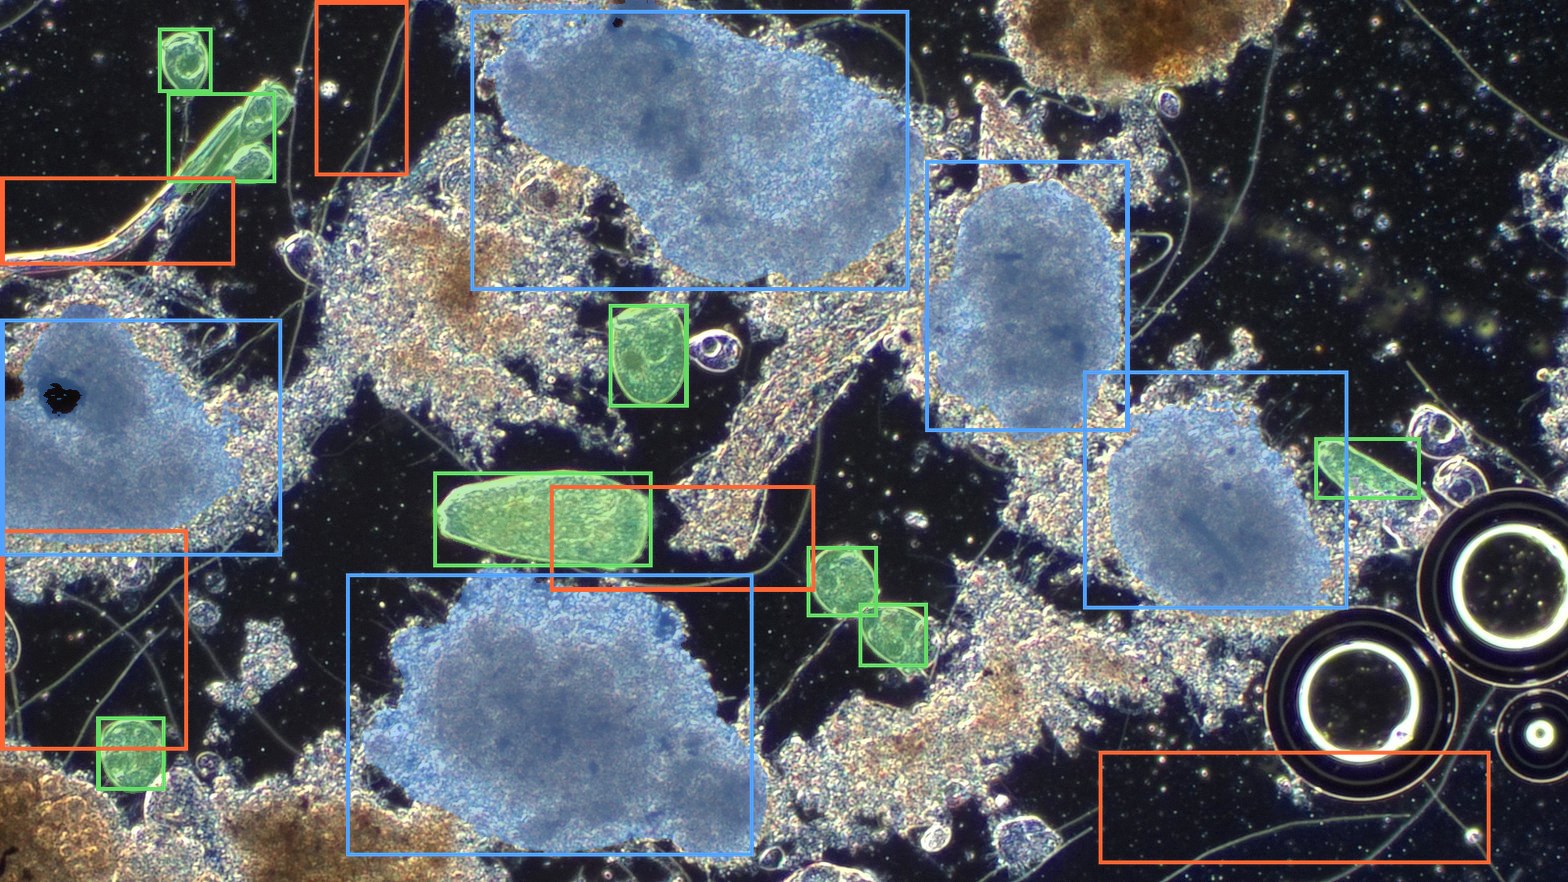
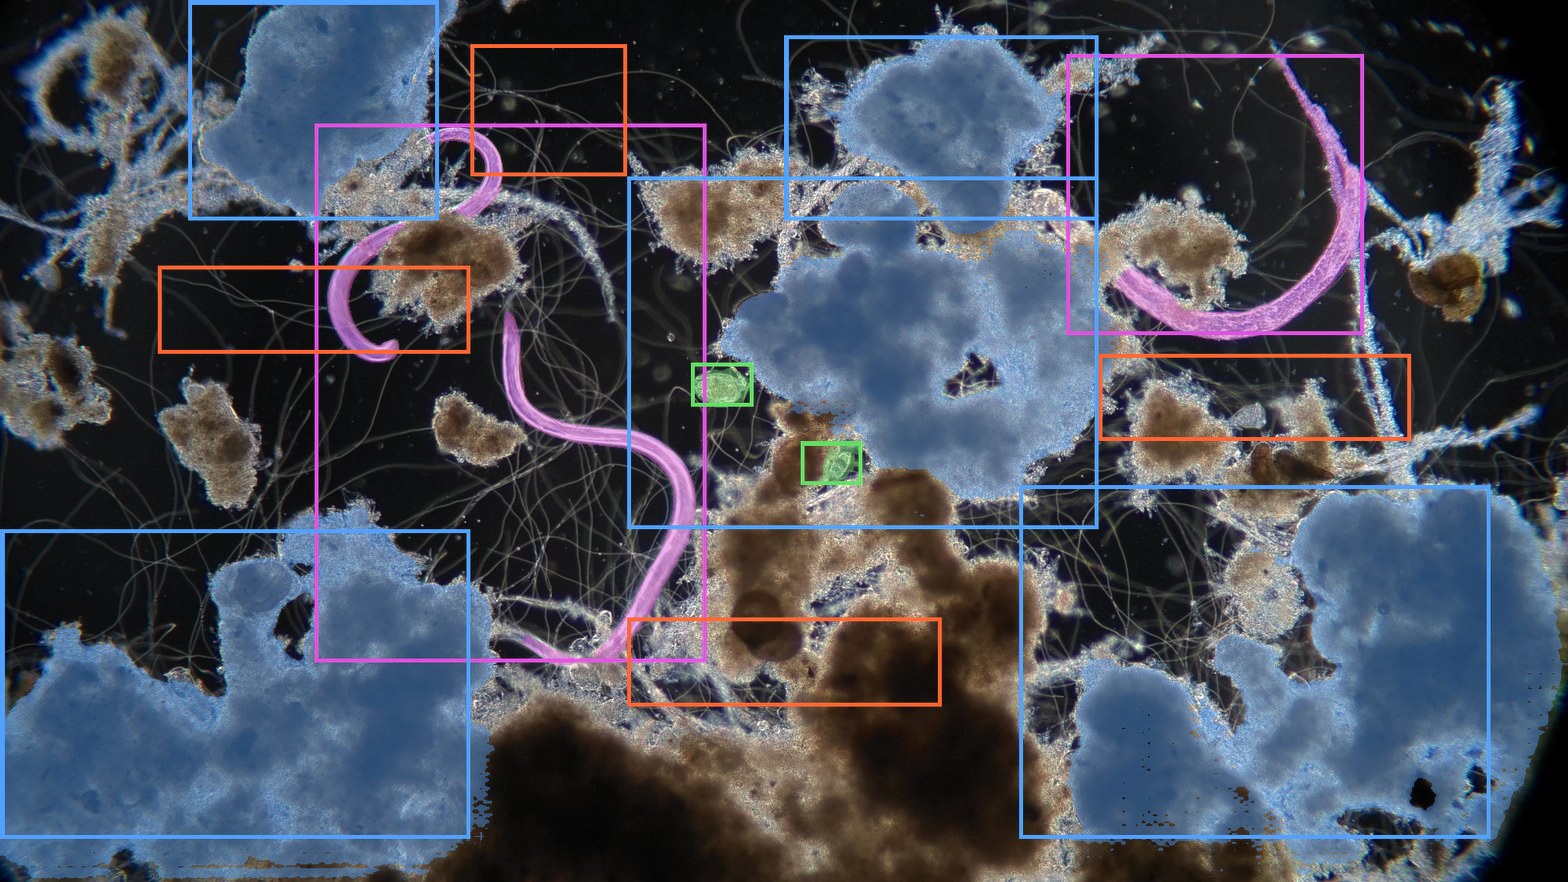
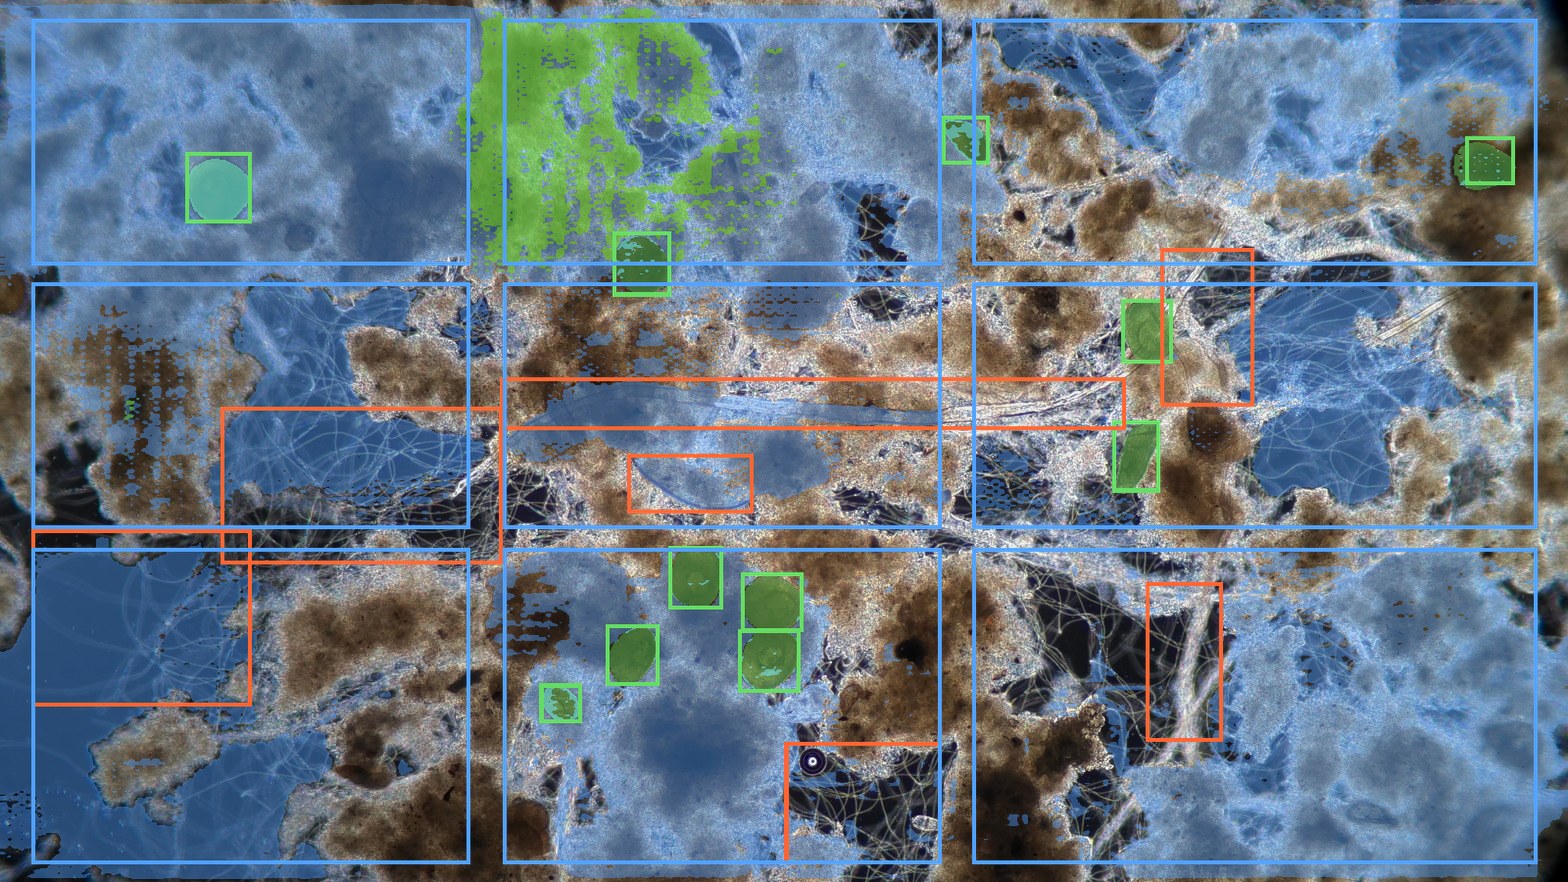
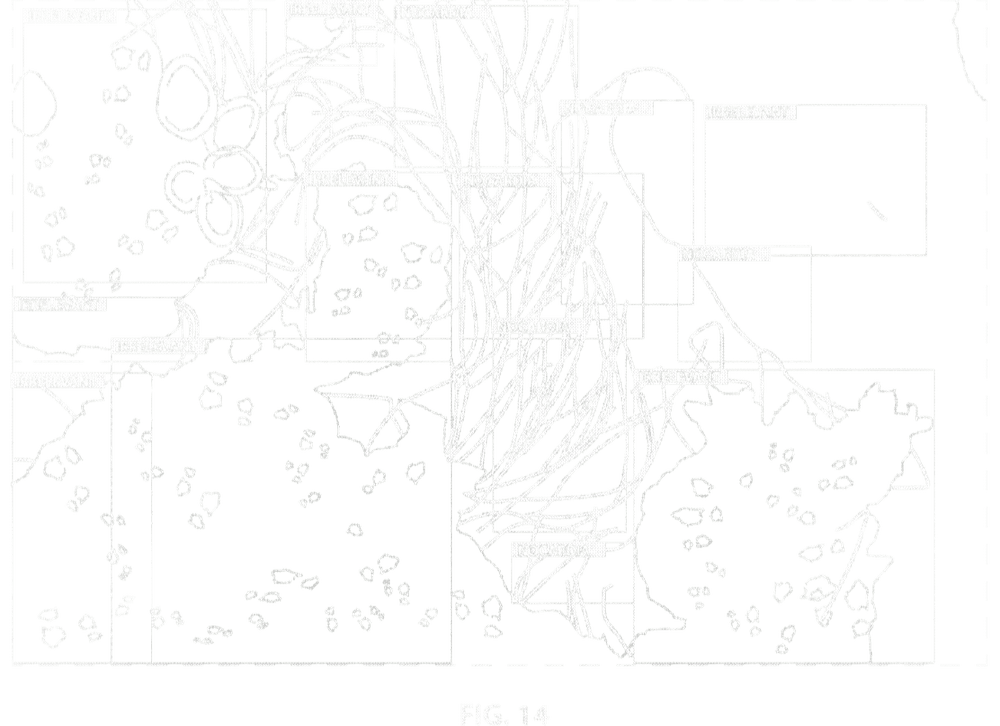
Organisms identified and labeled in real time.
FIG. 14 - Live object detection
FIG. 14 shows live detection output on an actual sludge sample. The system draws bounding
boxes around detected organisms, classifying each one by type and filtering out irrelevant
objects in the same frame. Here, Nocardia is identified across multiple locations within a
single microscopy frame.
Patent details
US 11,565,946 B2
Application No. 16/701,725 Filed: December 3, 2019 Granted: January 31, 2023 Expires:
December 3, 2039 Status: Active
Inventors
Edward Bryan Arndt Francis John DeOrio Patrick Joseph Campbell
Classification
Systems & Methods for Treating Wastewater
Computer Vision · Deep Learning · Microscopy Image Analysis · Real-Time Process Control
Bring Nymph to your plant.
Questions about pilots, pricing, or how Nymph fits your operation? Start the conversation and we will follow up directly.